
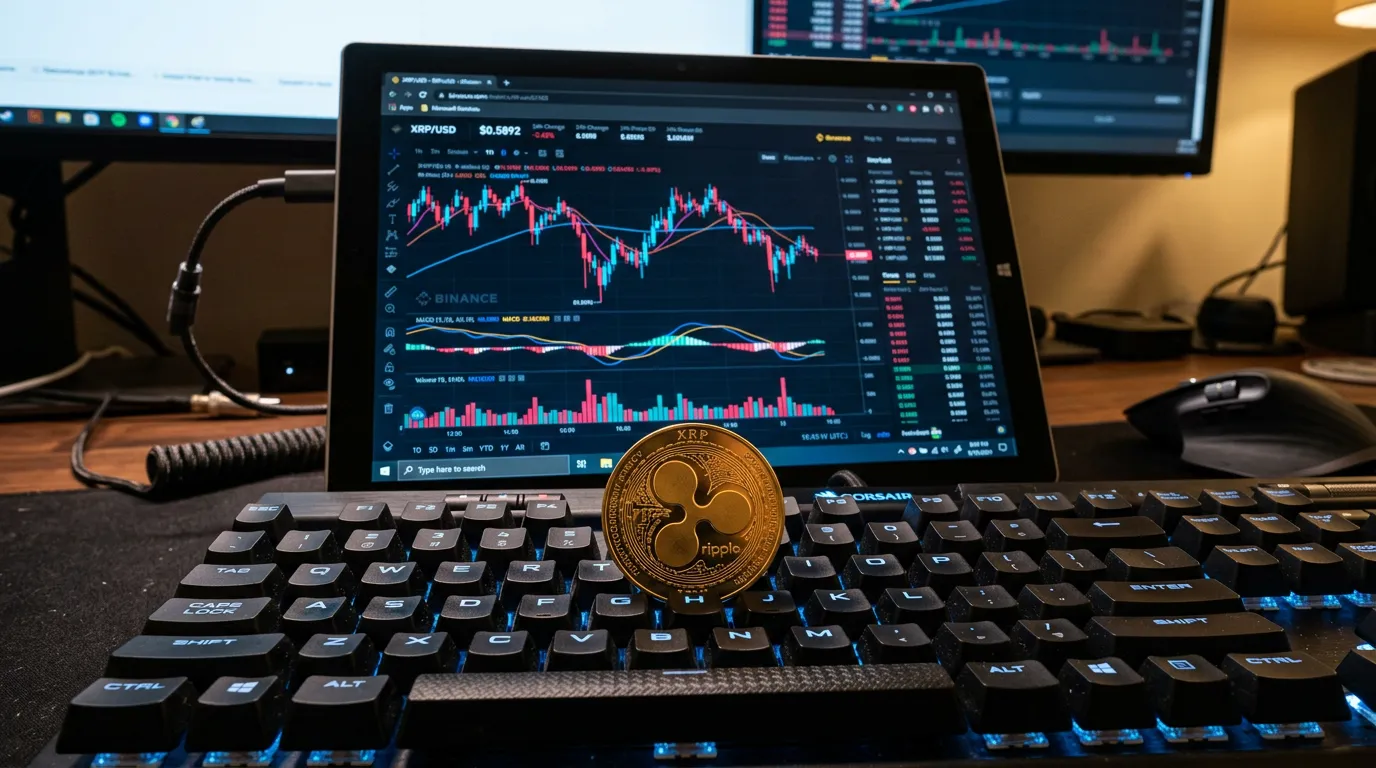
On March 5, 2026, Yahoo Finance’s Market Minute reports XRP-USD trading near $1.40 after repeatedly testing the $1.30 floor since February, with the $1.27–$1.30 zone acting as the real structural floor. This cushion is anchored by a cost-basis cluster of about 443 million XRP, whose holders are reluctant to sell at a loss, providing ongoing near-term support just beneath the $1.30 level.
Did You Know?
On-chain “cost-basis clusters” can act like invisible support: when many holders bought around the same price (here, about 443 million XRP near $1.27–$1.30), they often resist selling at a loss, helping defend that zone during repeated retests.
Source: Yahoo Finance Market Minute (Sam Daodu), Mar 5, 2026
Above, the report flags a supply wall at $1.58–$1.60 tied to roughly 2 billion XRP held by break-even sellers. It also pegs XRP’s short-term direction to Bitcoin, citing 0.84 correlation and a typical 1.8x response, while spotlighting risks from a BTC dip below $60,000, Middle East risk-off shocks, and whale transfers—about 472 million XRP ($652 million) to Binance in late February.
Next: the $1.27–$1.60 corridor, BTC linkage, exchange-flow risk, upside catalysts like ETF inflows (seven straight green days; AUM above $1.25B) and the CLARITY Act, plus macro context including U.S. stock pressure, ~6% mortgage rates, and Wells Fargo’s post-2018 enforcement-action lift.
Support and resistance: the $1.27–$1.60 corridor
On March 5, 2026, Yahoo Finance’s Market Minute reports XRP-USD trading near $1.40 after repeatedly testing the $1.30 floor since February, with the $1.27–$1.30 zone acting as the real structural floor. This cushion is anchored by a cost-basis cluster of about 443 million XRP, whose holders are reluctant to sell at a loss, providing ongoing near-term support just beneath the $1.30 level.
The reason that $1.27–$1.30 matters isn’t just technical chart symmetry; it’s positioning. A cost-basis “cluster” is essentially an on-chain map of where meaningful size last changed hands, and it often behaves like a behavioral price magnet: investors who bought in that region tend to defend it, while buyers front-run it with bids.
How the floor forms: cost-basis clusters and “defendable” support
That 443 million XRP cluster implies a dense band of addresses sitting with an average entry around the floor. In practice, tools such as Glassnode and CryptoQuant are used to visualize these pockets of supply by realized price and UTXO/transfer-derived cohorts, giving traders a more forensic read than a simple moving average on TradingView.
The ceiling: why $1.58–$1.60 is a “supply wall”
On the upside, a substantial supply wall sits between $1.58 and $1.60, involving roughly 2 billion XRP held by investors who would sell to break even, making a sustained breakout above $1.60 challenging. That dynamic creates a mechanical headwind: rallies into the band can trigger profitless exits and limit orders, forcing price to absorb inventory before it can trend.
The result is a tight operating range. The same report frames XRP as likely to consolidate in a $1.30–$1.50 range in the near term, even as the broader backdrop remains risk-sensitive: U.S. stock pressure amid geopolitical risk, mortgage rates hovering around 6%, and Wells Fargo slipping after a 2018 enforcement action was lifted, in a piece authored by Sam Daodu and time-stamped Thu, March 5, 2026 at 10:33 AM EST.
XRP’s link to Bitcoin: correlation and amplification
XRP-USD may be range-bound near $1.40, but its short-term direction is still largely a Bitcoin trade. Yahoo Finance’s Market Minute pegs the XRP-BTC correlation at 0.84, a tight relationship that effectively ties XRP’s risk profile to BTC’s tape, not just Ripple headlines.
That same read-through comes with a kicker: XRP has been “amplifying” Bitcoin’s moves by roughly 1.8x. In practice, that means when BTC trends, XRP often behaves like a higher-beta overlay—moving more, faster, in the same direction—while still being vulnerable to idiosyncratic supply/demand levels such as the $1.27–$1.30 structural floor and the $1.58–$1.60 supply wall.
Scenario lens for traders and long-term holders
For active traders using Binance, Coinbase, or Kraken, the math matters because it frames position sizing. A modest BTC move can become a meaningful XRP swing; a -10% BTC slide—especially if BTC breaks below the closely watched $60,000 area cited as a risk—can translate into mid-teens percentage downside in XRP on an “amplified” basis, quickly pressuring that $1.30 region.
Correlation is not causation, and it is not stable. It can weaken during XRP-specific events, but the reported 0.84 relationship implies that “diversification” into XRP still leaves a portfolio dominated by Bitcoin beta, with XRP’s order-book dynamics often acting as the volume knob.
When BTC trends up: XRP can sprint toward the $1.50 handle, but the $1.58–$1.60 sell wall can cap follow-through.
When BTC sells off: amplified downside raises the probability of repeated $1.30 tests, even without fresh XRP headlines.
When BTC chops: XRP is more likely to oscillate between the on-chain-supported floor and overhead supply, rewarding tight risk controls over conviction buys.
On-chain flows, exchange concentration, and downside risks
The sharpest near-term risk signal for XRP isn’t a chart level—it’s where coins move. Yahoo Finance flagged a late-February transfer of roughly 472 million XRP (about $652 million) to Binance, a concentration event that can matter even if it’s ultimately internal shuffling. When large size lands on a major venue with deep XRP liquidity, it increases the odds that supply becomes “sell-ready,” raising the probability of faster downside if bids thin out.
Exchange inflows tend to pressure price through simple mechanics: a bigger pool of coins available for market or limit sells, plus visible order-book overhead. If Binance’s ask side starts stacking above spot while on-chain deposits accelerate, sellers can pin rebounds—especially when XRP is already struggling to clear supply near the mid-$1.50s.
Downside triggers to keep on a tight dashboard
Bitcoin below $60,000: with high co-movement, a BTC air pocket can pull XRP through the $1.30 area quickly.
Risk-off headlines from the Middle East: volatility often hits alt liquidity first, widening spreads on Binance and Coinbase.
Repeat “whale to exchange” prints: watch XRPL-rich list activity on Bithomp, plus exchange netflow trackers like CryptoQuant and Glassnode.
Potential upside catalysts: ETFs, CLARITY Act, and momentum
XRP’s bullish case is currently less about idiosyncratic token demand and more about whether risk appetite keeps improving across crypto. The Yahoo Finance report flags a “green streak” in ETF flows—seven consecutive positive days and assets above $1.25 billion—as a sentiment input that can lift beta names when traders rotate out the sidelines.
That ETF bid matters because XRP’s tape still trades as a high-octane proxy for Bitcoin. With correlation cited at 0.84 and an estimated 1.8x amplification of BTC moves, a clean Bitcoin push higher can quickly put $1.50 back in play, even if XRP-specific headlines stay quiet.
Regulatory “re-rating” risk: CLARITY Act
The other catalyst is legislative: the CLARITY Act. Ripple CEO Brad Garlinghouse has said there is a 90% chance of passage by April, and the report notes the act could classify XRP as a digital commodity—language that would reshape how brokers, exchanges, and U.S.-based market makers model compliance risk.
Why $1.60 still caps the tape
Even if those catalysts line up, the overhead structure remains heavy. The $1.58–$1.60 zone is described as a supply wall tied to roughly 2 billion XRP held by investors who may sell into strength to get back to breakeven, raising the bar for a sustained push above $1.60 rather than a brief wick.
Macro backdrop and trading outlook
Risk sentiment is setting the tone. U.S. equities were under pressure alongside fresh geopolitical risk, with mortgage rates hovering near 6% and Wells Fargo sliding after news that a 2018 enforcement action had been lifted—headlines that can still read as “tight financial conditions” for traders.
That matters for crypto because the same risk-on/risk-off switch that hits high-beta stocks often hits altcoins harder. XRP-USD near $1.40 is behaving like a macro proxy: support remains concentrated in the $1.27–$1.30 structural floor, while upside is capped by the $1.58–$1.60 supply wall.
With XRP’s 0.84 correlation to Bitcoin and ~1.8x amplification, the base case stays consolidation in the $1.30–$1.50 band unless Bitcoin momentum improves, spot Bitcoin ETF inflows extend, or Washington delivers clearer rules via the CLARITY Act.
Frequently Asked Questions
XRP-USD is hovering near $1.40, but the debate is still about levels and flows: whether the $1.27–$1.30 base holds, and whether buyers can absorb the $1.58–$1.60 supply wall.
What does the $1.27–$1.30 floor mean for XRP holders? ▼
How likely is XRP to break above $1.60, and why is that level important? ▼
How does Bitcoin’s performance affect XRP? ▼
Should investors worry about large transfers to exchanges like the 472M XRP to Binance? ▼
What would regulatory clarity via the CLARITY Act mean for XRP’s price? ▼
Which indicators should traders watch for a breakout or breakdown? ▼
Macro cross-currents—Middle East tensions, pressure in U.S. equities, and mortgage rates near 6%—are also shaping the risk mood around Bitcoin and, by extension, XRP.
Conclusion
On March 5, 2026, Yahoo Finance’s Market Minute reports XRP-USD trading near $1.40 after repeatedly testing the $1.30 floor since February, with the $1.27–$1.30 zone acting as the real structural floor. This cushion is anchored by a cost-basis cluster of about 443 million XRP, whose holders are reluctant to sell at a loss, providing ongoing near-term support just beneath the $1.30 level.
🎯 Key takeaways
- → Key levels: $1.27–$1.30 structural support vs. $1.58–$1.60 supply wall; range bias $1.30–$1.50.
- → Macro driver: XRP remains tethered to Bitcoin (0.84 correlation) and often moves ~1.8x BTC; a BTC dip below $60,000 is a clear downside risk.
- → Watchlist: Binance inflow spikes (e.g., 472M XRP in late Feb), spot Bitcoin ETF flows (7 green days; AUM >$1.25B), and CLARITY Act progress (Ripple CEO cites 90% odds by April).
On the upside, the $1.58–$1.60 wall—about 2 billion XRP held at break-even—keeps rallies honest, while the tape remains tied to Bitcoin amid U.S. stock pressure, Middle East tensions, ~6% mortgage rates, and Wells Fargo sliding after a 2018 enforcement action was lifted. Practical next steps: track Bitcoin’s $60,000 line, watch Whale Alert and CryptoQuant for exchange deposits (including Binance), follow daily U.S. spot Bitcoin ETF flow dashboards, and monitor CLARITY Act headlines for confirmation—or delay—of a push beyond $1.50.


0 Comments